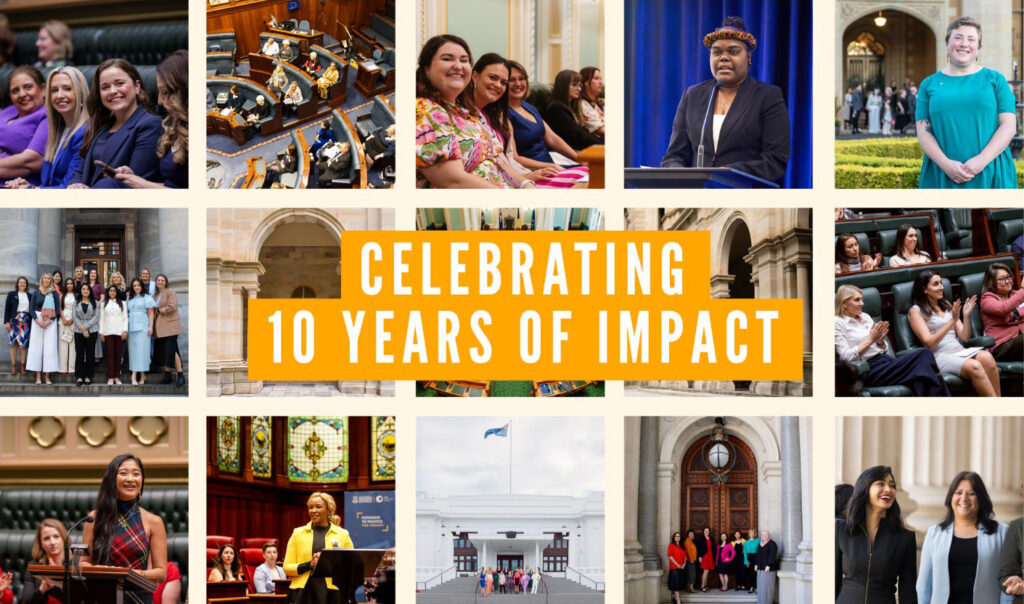
For more than a decade, we’ve worked tirelessly to equip women to boldly embrace their political ambitions, thrive as leaders and make a profound contribution to society.
On this page, we’re counting the change – highlighting the numbers that reflect our impact, from the diversity of women supported through Pathways to Politics, to electoral impact made across Australia at all levels of government.
These figures tell the story of a growing movement changing the face of politics in Australia.
Read more in our milestone 10-year anniversary publication.
ELECTORAL IMPACT
electoral successes
at local, state and federal levels of government in the past decade
(including alums successful in multiple electoral cycles)
Federal
(ALP, Liberal)
State/Territory
(Animal Justice Party, Country Liberal Party, Greens, ALP, Liberal, LNP, Nationals)
Local Government
(Greens, Independent, ALP, Liberal, LNP)
IN 2026
alums are currently serving in our parliaments and councils
IN 2024
120 alums ran in state, territory and local elections, with 49 elected
– a 41% success rate!
Significant numbers of alums have run for public office
with a …

And intention to run remains high

Our alums show a clear commitment to running for public office
OUR PARTICIPANTS
Our alum community is growing rapidly – and reflects the diversity of communities across Australia
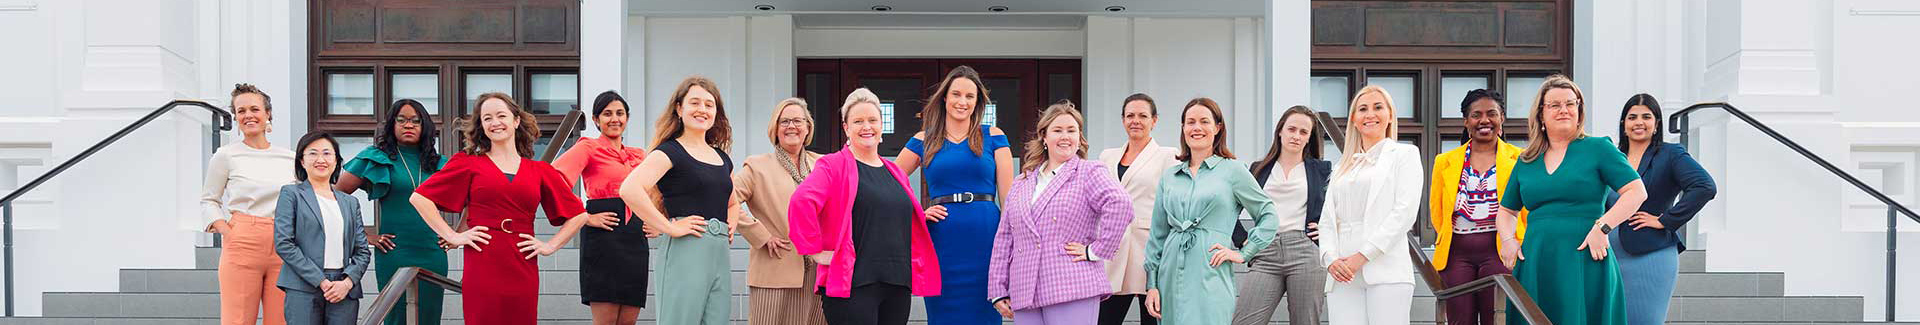
We’ve expanded to every state and territory
Our participants reflect a diversity of backgrounds and experiences
The proportion of participants identifying with equity groups has increased over time
IN 2025:
We are proudly non-partisan
Our participants reflect the political spectrum

Read more in our milestone 10-year anniversary publication: