How does Australian politics stack up when it comes to gender equality and representation?
This scorecard of gendered representation in politics provides contextual analysis of the current Australian political landscape from a global, federal, state, and local government perspective to recognise the gaps and stimulate lasting change towards gender parity in Australian politics.
How Australia ranks globally

In 2025, Australia is ranked 13th out of 146 countries in the Global Gender Gap Index, rising 11 places since 2024.

For political empowerment, Australia is ranked 19th out of 146 countries, a huge improvement from 28th in 2024.

Ranked 30th for Women in parliaments (improvement from 33rd in 2024)

Ranked 8th for Women in ministerial positions (huge improvement from 17th place in 2024, significant increase from 64th in 2022)

Source: World Economic Forum, Global Gender Gap Report 2025.
The Global Gender Gap Index benchmarks the current state and evolution of gender parity across four key dimensions (Economic Participation and Opportunity, Educational Attainment, Health and Survival, and Political Empowerment). It is the longest-standing index which tracks progress towards closing these gaps over time since its inception in 2006.
Gender representation in Federal Parliament
Gender parity in the Australian parliament is finally within reach following the 2025 election.
Total representation in Federal Parliament

women
(112 women, 114 men)
House of
Representatives
women
(69 women, 81 men)
Senate
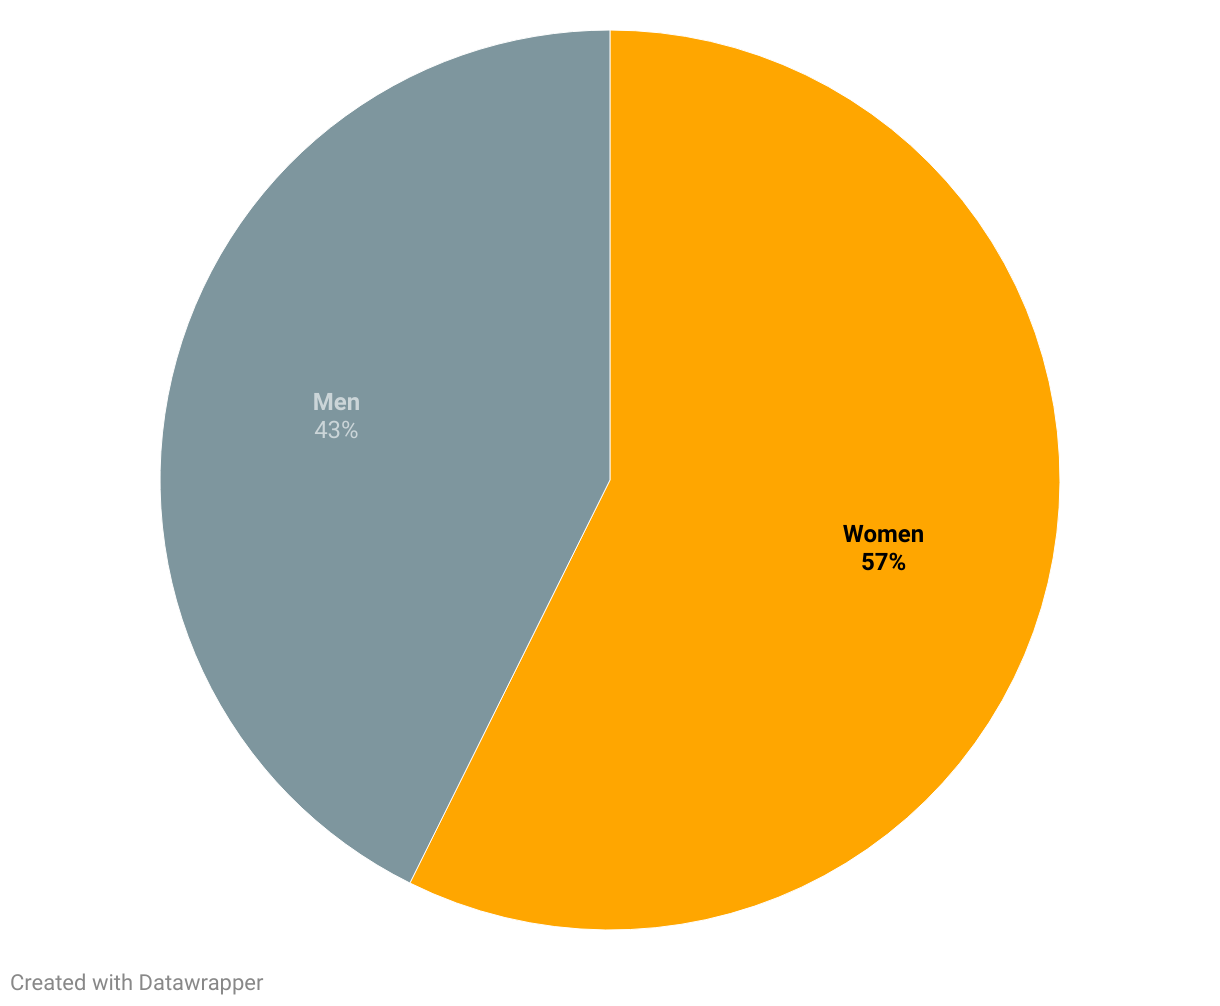
women
(43 women, 33 men)
Commonwealth Parliament gender representation after the 2025 federal election – by party
Across all Australian parliaments:
- 67% of Greens MPs are women
- 53% of Labor MPs are women
- 40% of minor party and independent MPs are women
- 33% of Coalition MPs are women
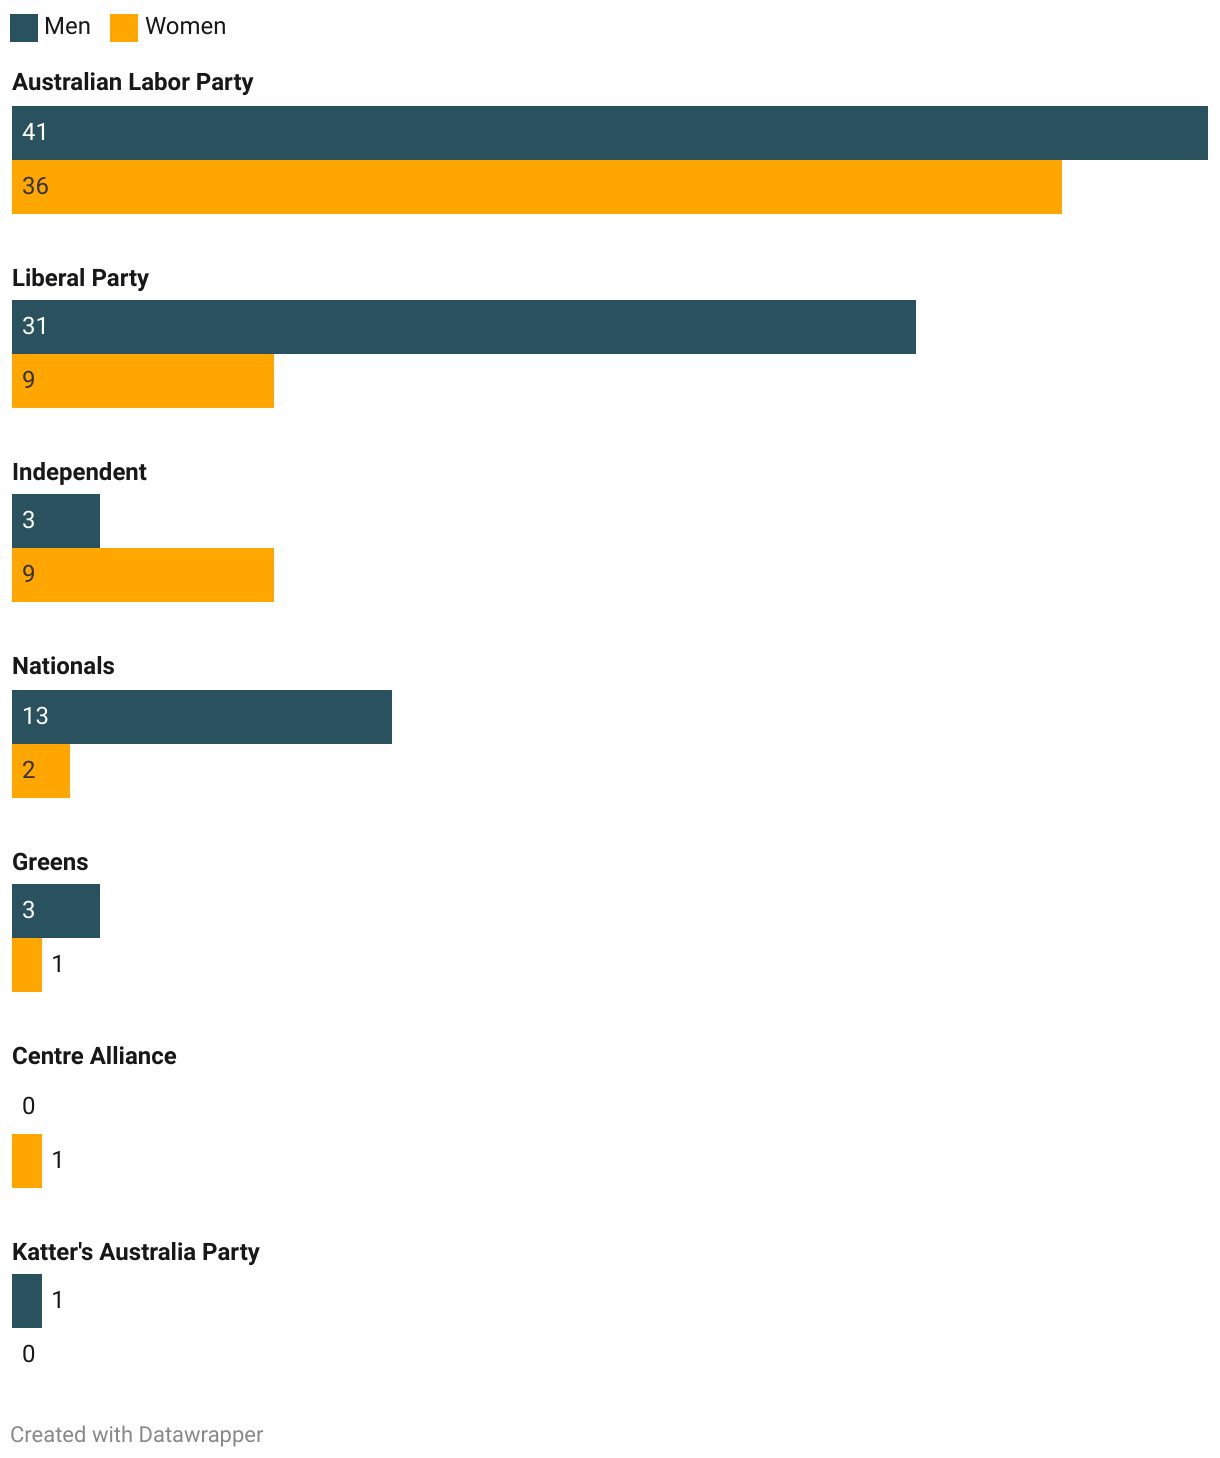
Source: Australia Institute, 19 June 2025
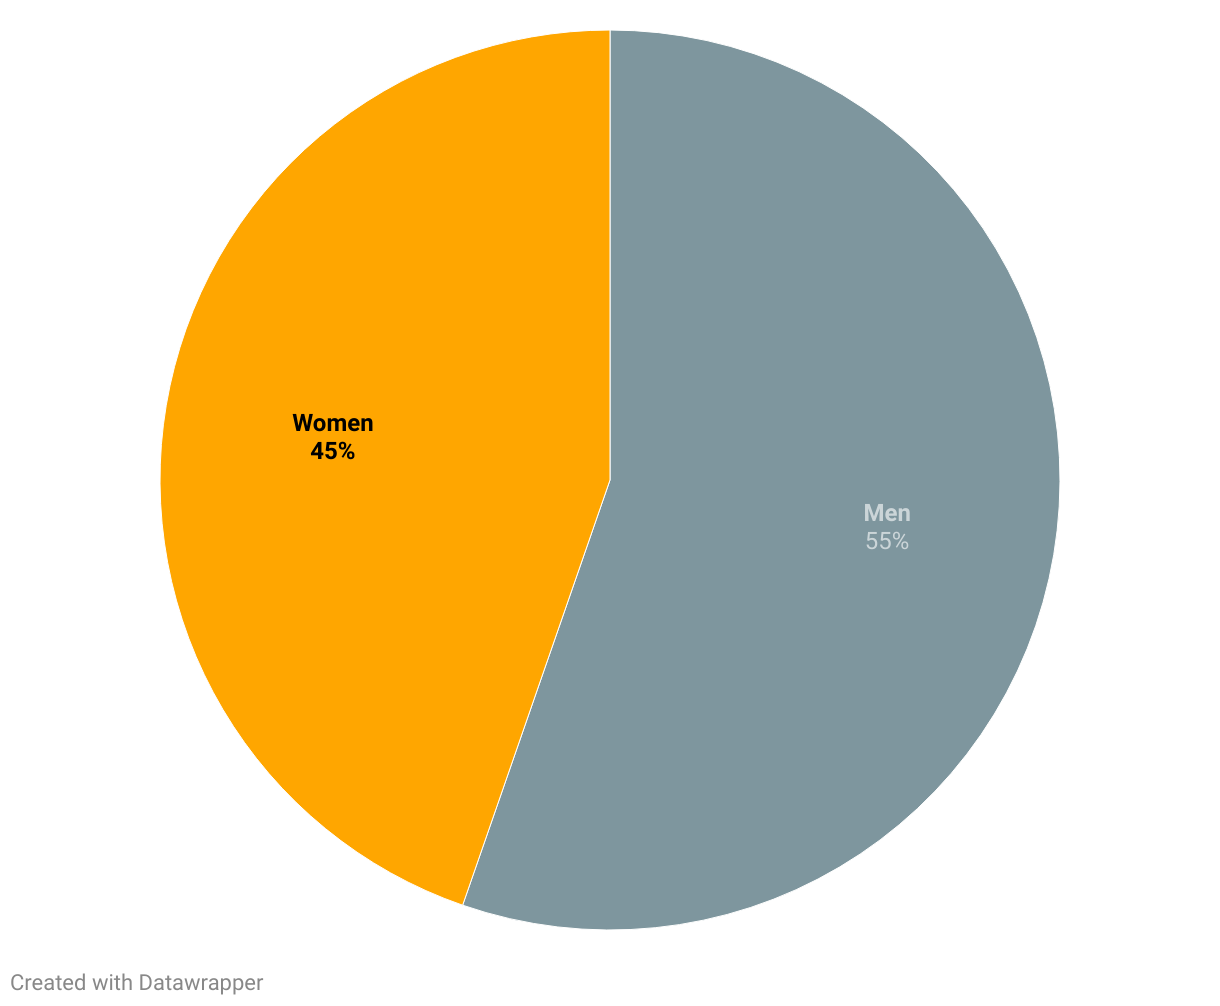
Gender representation in state and territory parliaments
Women account for 44.3% of overall positions in State and Territory Parliaments in Australia – a slight decrease from 45.1% in 2024 (prior to the WA and Tasmanian state elections)
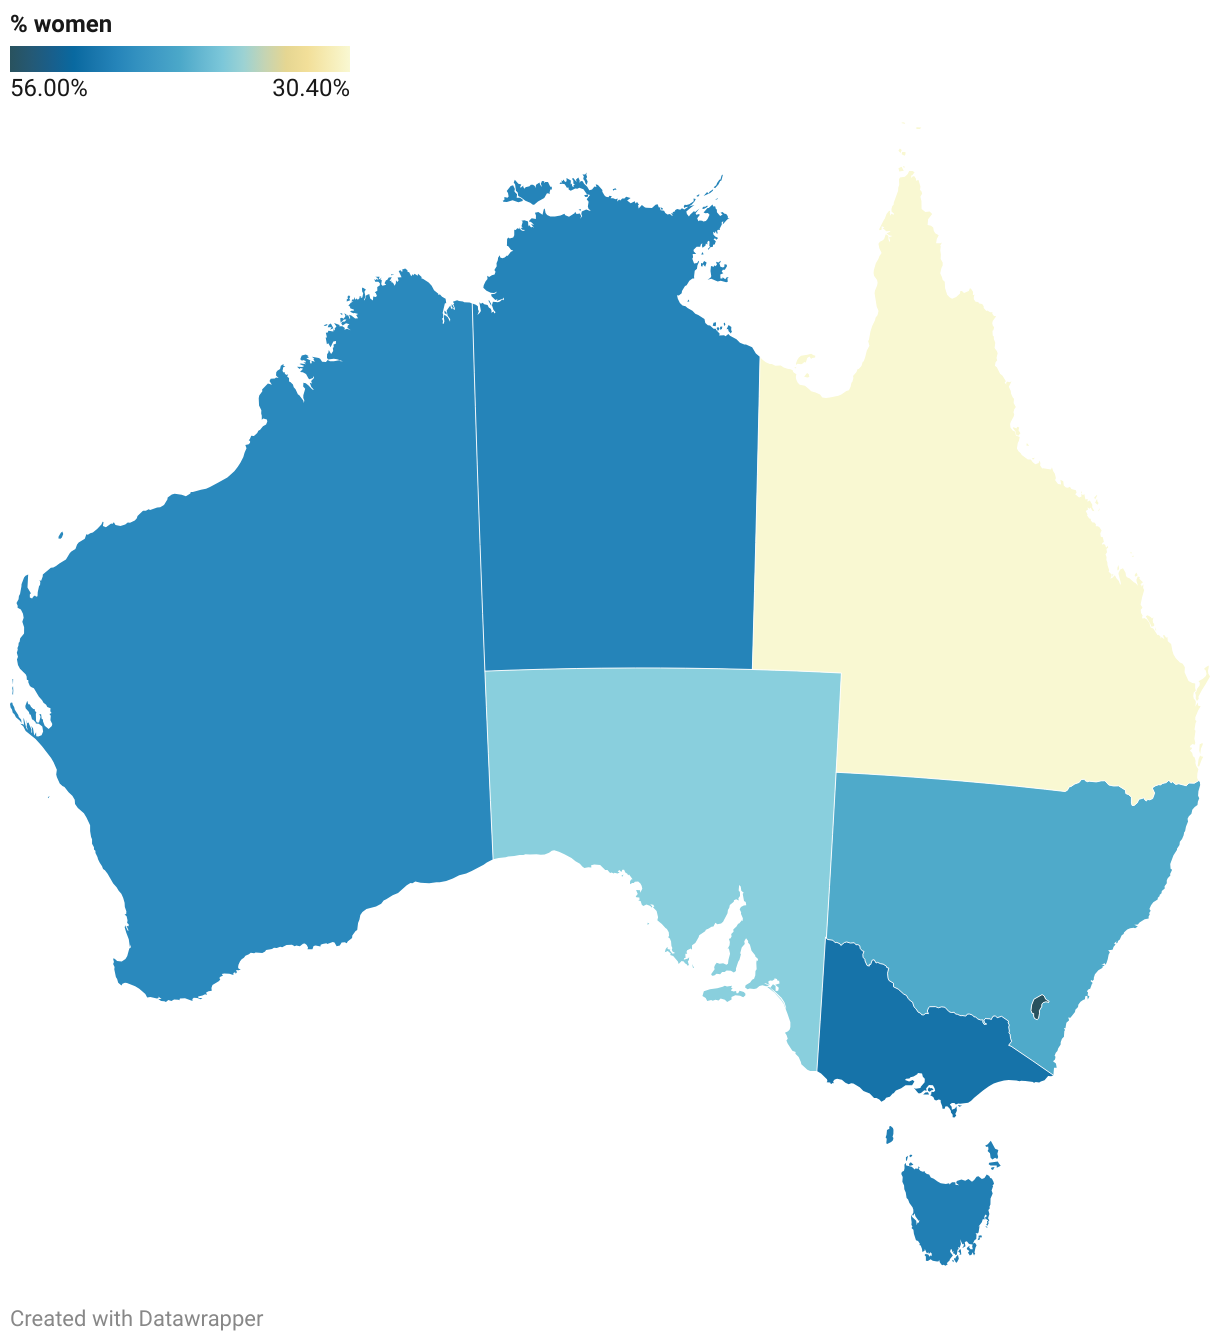
Source: Australian Federal Parliament, Gender composition of Australian parliaments by party: Table 2 as at 23 January 2024, updated with results from the February 2025 Prahran by-election, data from Tasmanian Electoral Commission following March 2024 Tasmanian State election, data from Legislative Assembly of the Northern Territory List of Members – 15th Legislative Assembly following the Northern Territory General Election August 2024 election and data from Queensland Parliament Members List following October 2024 Queensland State election.
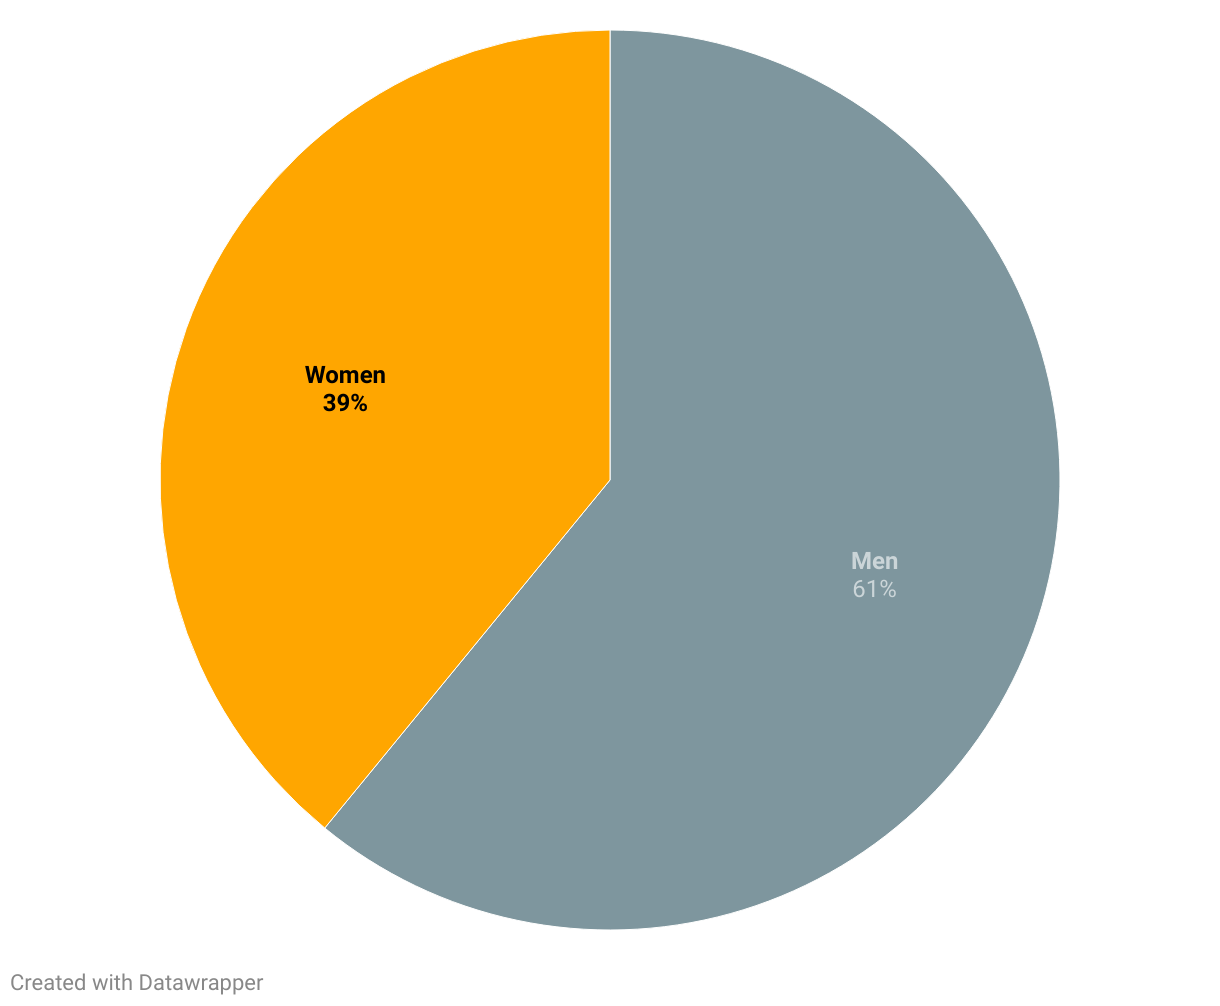
Gender representation in local councils
At the start of 2024, 39.3% of councillors were women. Today that has risen to 40.1%.
Victoria still leads the country despite dropping to 43.2% (from 43.8%), Tasmania follows on 42.5%, Queensland 42.2%, New South Wales 40.5%, South Australia 40%, Western Australia 39.6% and the Northern Territory 33%.
Victoria

Following the local council elections in October 2023, Victoria has the highest representation of female councillors in Australia with 43.2% (despite dropping from 43.8% at the 2020 elections)
Source: ALGWA, 2025
Tasmania
Female councillors make up 42.5% of Tasmanian councils
Since 2014, there has been a steady increase in the number of female local government candidates. At the 2022 local government elections there were 181 female candidates, compared to 173 female candidates in 2018 and 135 in 2014.
Sources: ALGWA, 2025; Tasmanian Government (Department of Premier and Cabinet) 2022, Women and diversity in local government
Western Australia
Women councillors make up 39.6% of Western Australian councils
36% of Mayors/Presidents are women
Source: WA Local Goverment Association 2022, History of Local Government
Queensland
Women councillors make up 44% of the 77 councils in QLD
35% of Mayors are women
Women candidates had a higher success rate than men in the 2024 local council elections. 245 Women elected out of 534 female candidates = 46% success rate!
Source: Local Government Association Queensland 2024
The Queensland Women’s Strategy 2016-2021 set a target of 50% of Queensland Local Government Board Members by 2020 target, which was achieved (4 women out of 7 members).
Source: Local Government Managers Australia Queensland 2017, Strategic Plan 2017-2021
South Australia
Women make up 40% of councillors South Australia
Susan Grace Benny was Australia’s first female politician in elected office, becoming a member of SA’s Brighton Council in late 1919
Sources: ALGWA, 2025; Government of South Australia Office for Women, Leadership and Participation – Local Government
New South Wales
Women councillors make up 40.5% of the 128 councils in NSW

3% of NSW councillors identify as living with a disability

2% of NSW councillors identify as Aboriginal or Torres Strait Islander
Sources: ALGWA, 2025; NSW Office of Local Government 2021, Become a Councillor
Pathways to Politics tracker
92 electoral successes across all sides of politics and all levels of government since we launched in 2016

More than 750 alums nationally
For more national data, program and speaker information, links to alum profiles, quotes, photos and brand assets.

 Read
Report
Read
Report